
Copenhagen tops the Happy City Index 2026, followed by Helsinki, Geneva, Uppsala and Tokyo. Produced by the Institute for Quality of Life, the ranking assesses 250 cities using 64 indicators covering everything from housing and education to air quality, healthcare, governance and public transport. Like most rankings, the Happy City Index naturally draws attention to the leaderboard. But rankings invite us to look at who came first; methodologies raise a more useful question: what exactly had to be measured for a city to get there?
This matters particularly when the subject is happiness. Unlike population, income or air pollution, happiness cannot simply be counted. Every attempt to rank “happy cities” therefore begins with a decision about what happiness means and which aspects of urban life can reasonably represent it.
The more interesting story behind the Happy City Index 2026 is therefore not whether Copenhagen deserves first place, but what kind of city the Index defines as a happy one.
How do you measure a happy city?
The 2026 methodology uses 64 indicators organised into six themes: Citizens, Governance, Environment, Economy, Health and Mobility. They range from housing affordability, homelessness and access to education to green space, PM2.5 pollution, life expectancy, voter turnout and public transport use.
Not all indicators are treated in the same way. The methodology distinguishes four types, separating city-level performance from national conditions that municipalities cannot directly control. Country-level contextual indicators such as GDP growth or patent activity are capped at 0.5 percentage points of the total score, while national policies with a more direct effect on everyday life can carry greater weight.
This addresses a familiar problem in urban rankings: cities can otherwise be rewarded or penalised for conditions largely determined at national level. It also makes explicit an important question: where does the performance of the city end and that of the country begin?
As New Polis noted in an earlier analysis of smart city ranking methodologies, rankings do not simply compare cities: choices about indicators, weighting and data inevitably shape the picture they produce.
Happiness without asking whether people are happy
Yet one feature of the methodology is striking. Despite its name, the Happy City Index does not directly ask residents how happy they are. This sets it apart from approaches based on subjective well-being. The World Happiness Report, for example, relies heavily on people’s own evaluations of their lives. As New Polis has discussed before, such surveys also have limitations: responses can be shaped by culture, expectations and comparison with others.
The Happy City Index largely takes the opposite route. Rather than asking residents to evaluate their lives, it measures the conditions around them: whether housing is affordable, the air is clean, green space is available, healthcare and education are accessible, local government is responsive and transport works.
Good urban conditions and human happiness are related, but they are not the same thing. A city can provide excellent services, infrastructure and environmental quality without demonstrating that its residents are happier than those elsewhere. This does not make the Index less useful. It changes what its results mean.
But how different is the picture when residents themselves are asked? To explore how the HCI picture compares with residents’ own perceptions, New Polis compared its results with the latest available European Commission Report on the Quality of Life in European Cities. The survey covers 83 European cities and more than 70,000 interviews, including a question on whether residents are satisfied with living in their city. The comparison is indicative rather than direct: the European survey was conducted in early 2023, while the HCI 2026 primarily relies on more recent data. It should therefore be read as a comparison of two different approaches to assessing urban life, rather than as a like-for-like test of their results.
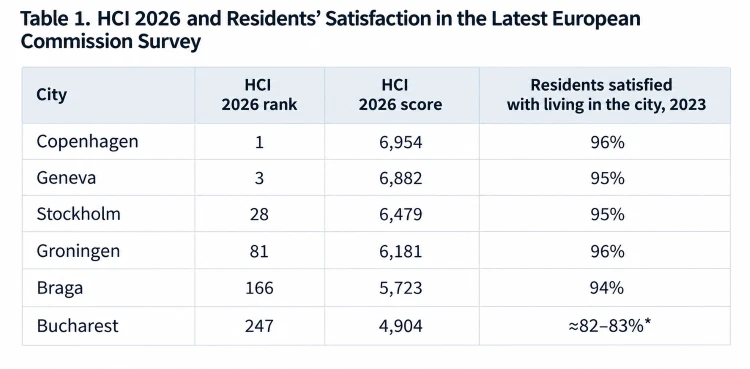
* Approximate value read from the European Commission survey chart; unlike the Top and Bottom 10 values, an exact rounded figure for Bucharest is not reported in the corresponding summary table.
Sources: New Polis analysis based on the Happy City Index 2026, Institute for Quality of Life, and European Commission, Report on the Quality of Life in European Cities 2023. HCI rank and score refer to 2026; resident satisfaction refers to the 2023 European Commission survey.
For some cities, the two perspectives align remarkably well. Copenhagen ranks first in the HCI and 96% of surveyed residents say they are satisfied with living there. Geneva ranks third with 95% satisfaction, while Stockholm combines 28th place with the same 95%. But the relationship quickly becomes less straightforward. Groningen records the same 96% resident satisfaction as Copenhagen despite ranking 81st in the HCI. Braga provides an even sharper contrast: it ranks 166th, yet 94% of its surveyed residents are satisfied with living there, only two percentage points below Copenhagen.
Bucharest is perhaps the most striking case. It ranks 247th out of 250 cities in the HCI, with a score of 4,904, yet roughly 82–83% of respondents in the European survey appear satisfied with living in the Romanian capital. This does not mean residents are unaware of its problems. In the same European Commission survey, for example, only 30% were satisfied with noise levels, the lowest result among the 83 cities surveyed.
These discrepancies do not tell us that one measure is right and the other wrong. Rather, they suggest that the conditions a city provides and residents’ overall experience of living there can produce quite different pictures. Neither can simply substitute for the other.
What the Happy City Index 2026 rewards and why it matters
The choice of conditions measured by the HCI is therefore crucial. Some are difficult to dispute: life expectancy, PM2.5 pollution and green space per capita each account for 3% of the score, while rental affordability carries 2.48%. But other choices reveal more clearly the assumptions built into the Index. Having a globally ranked university, for example, also carries a 3% weight, equal to life expectancy or air pollution. Local election turnout accounts for 2.84%, while AI awareness in city strategies contributes 1.2%.
The point is not that such indicators are necessarily irrelevant. It is that selecting and weighting them inevitably embeds a particular idea of what a good city looks like. In the Happy City Index, that city is healthy and green, but also educated, economically viable, digitally capable, participatory and well connected. It is an attractive model, but still a model rather than a universal definition of happiness.
There is also a more practical constraint: what can be measured shapes what gets measured. The methodology explicitly considers the availability of comparable data, and data availability affects which cities reach the final ranking.
The process began with 3,417 cities. After initial selection, 924 were identified for deeper analysis; data for 457 cities entered the validation process, 272 passed, and the top 250 were published in the formal ranking. Cities with limited accessible and comparable urban data therefore face an additional barrier to entering the final comparison.
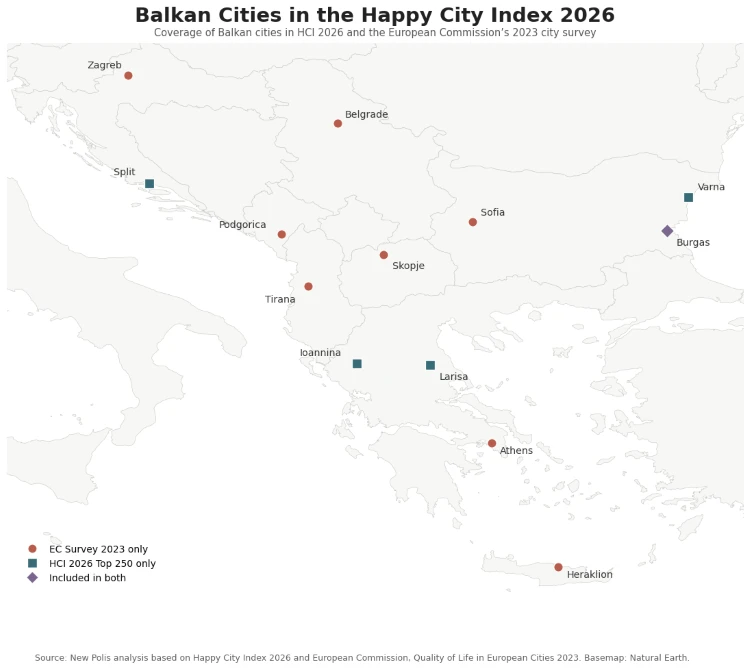
The Balkans offers an interesting illustration of this selection problem. The European Commission’s 2023 survey includes seven Balkan capitals: Athens, Tirana, Belgrade, Skopje, Podgorica, Zagreb and Sofia. None appears in the HCI 2026 Top 250. Five of them — Athens (65%), Tirana (66%), Belgrade (69%), Skopje (72%) and Podgorica (77%) — are also among the bottom ten of the 83 cities surveyed for residents’ satisfaction with living in their city.
The overlap between the two datasets in the region is remarkably limited. Of the Balkan cities covered by either study, Burgas is the only one included in both. Split, Larisa, Ioannina and Varna appear in the HCI 2026 Top 250 but not in the European Commission survey, while Zagreb, Belgrade, Sofia, Podgorica, Tirana, Skopje, Athens and Heraklion appear in the European survey but not in the HCI Top 250. Bosnia and Herzegovina, meanwhile, has no city represented in either dataset. The published HCI methodology does not explain why particular cities are absent, but this uneven coverage is worth noting in an index whose selection process depends partly on data availability and validation.
There is an additional twist. The Index itself rewards features of data-rich governance, including open-data portals, machine-readable datasets and open public-transport data. This is not simple double counting: transparency and open data can reasonably be treated as qualities of good governance. But cities that are easier to measure may also perform better on some of the things being measured.
This raises a broader question that applies well beyond the Happy City Index: to what extent are global city rankings also rankings of the world’s most measurable cities?
Happy City Index data: reliable evidence, debatable choices
One of the Index’s strengths is that it takes data quality seriously. According to its methodology, 466 researchers participated in the project. Data collected for 457 cities went through a peer-validation process in which ten records from each city dataset were randomly selected for assessment by other researchers. Of those cities, 272 passed validation. But data quality and conceptual validity are different questions. Validation can tell us whether an observation is well supported; it cannot tell us whether it is the right observation to use when measuring a happy city. A university’s position in a global ranking can be carefully verified, for example, without resolving whether it should carry the same weight as life expectancy.
The Index also uses controlled estimates rather than assigning zero where data are missing. Publishing the share of estimated data for each city, however, would make the uncertainty behind individual scores easier to assess.
Reading the ranking differently
None of this makes the Happy City Index arbitrary. Its broad scope, explicit weighting, distinction between national and urban conditions and visible validation process make it a useful comparative tool. The Index’s own authors also caution that it is “not designed to declare a single ‘best city’ in the world”, grouping cities into GOLD, SILVER and BRONZE categories alongside the numerical ranking.
But the comparison with residents’ perceptions adds an important qualification. In cities such as Copenhagen and Geneva, strong measurable urban conditions and high resident satisfaction appear to reinforce each other. In Groningen, Braga and especially Bucharest, the relationship is much less straightforward.
The comparison is not a test of which approach is “correct”. Objective indicators can identify conditions, services and policy outcomes that residents may take for granted or evaluate differently. Subjective assessments, meanwhile, are shaped by expectations, culture, social relationships and attachment to place. But if the subject is urban happiness, both perspectives matter.
A fuller understanding of a happy city therefore requires at least two lenses: the conditions a city provides and the way residents experience living there. Neither tells the whole story on its own.
Copenhagen’s first place does not demonstrate that its residents are happier than people in every other city. It shows that Copenhagen performs exceptionally well against an explicit model of the urban conditions associated with a good life. The fact that its residents also report exceptionally high satisfaction strengthens that result, but the cases of Braga and Bucharest show why the distinction still matters.
Perhaps, then, the most useful question raised by the Happy City Index is not which city is the happiest, but what kind of city we have decided to call happy.