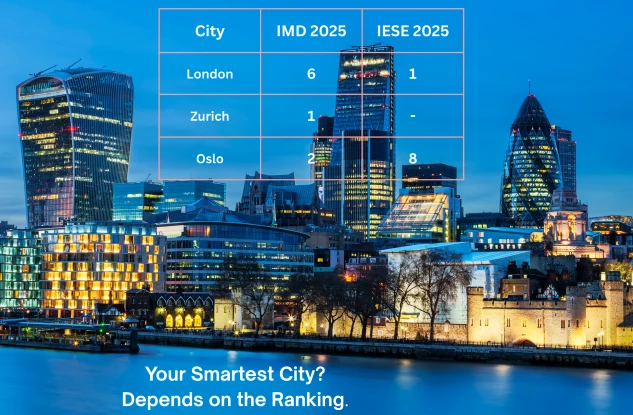
Every year, global media publish lists of the world’s smartest cities. Yet behind these headlines lies a more complex issue: the methodology of smart city rankings is far from uniform. In the first part of this analysis, we explored how different theoretical approaches shape smart city rankings. In this second part, we focus directly on smart city ranking methodology, the technical framework that determines how the Top 10 cities of 2025 are actually calculated. Some models prioritise citizen perception. Others emphasise infrastructure, innovation ecosystems or municipal digital capacity. That is why London, Zurich, Oslo and Dubai appear in different positions depending on the index. The divergence reflects different definitions of what “smart” actually means. But definitions are only the first layer.
Once a concept is translated into indicators and composite scores, it begins to look objective. A city is ranked 1st, 12th or 46th. Decimal precision suggests certainty. Yet behind every league table lies a sequence of methodological choices. Those choices shape the outcome as much as urban reality itself. Understanding smart city ranking methodology therefore means moving from theory to calculation.
Indicator selection: what gets counted in smart city ranking criteria
Every ranking begins with a deceptively simple question: what counts?
The IMD Smart City Index 2025 evaluates 146 cities worldwide, up from 142 in 2024. In the latest edition, Zurich ranks first, followed by Oslo and Geneva. IMD’s model is perception-driven. Around one hundred residents per city respond to questions about mobility, governance, safety, health and opportunities. These survey responses are combined with selected secondary indicators and processed through a structured methodology. In terms of smart city index methodology, this places lived experience at the centre of evaluation.
The logic is straightforward: a city is smart if residents experience it as smart. But perception-based systems inevitably raise questions about representativeness, response bias and cross-cultural comparability.
The IESE Cities in Motion Index adopts a broader systemic approach. Covering 183 cities across 92 countries, it relies on more than one hundred indicators distributed across nine dimensions, including governance, mobility, environment and social cohesion. Instead of relying on equal weighting, IESE applies a statistical method known as DP2 to structure and aggregate indicators. Here, smart city ranking methodology is grounded in statistical modelling rather than perception surveys.
The ProptechOS Smart City Index 2025 narrows the lens. Expanding from 68 cities in 2024 to 95 in 2025, it concentrates on infrastructure readiness, digital connectivity and ecosystem strength. This reflects an alternative interpretation of how smart city rankings are calculated, one that privileges infrastructure and market metrics.
The Bitkom Smart City Index 2025, limited to Germany, evaluates 83 cities through 37 indicators across five domains, generating more than 13,000 data points. Within this national framework, urban digital ranking methods emphasise documented municipal implementation and digital governance maturity.
Seen together, these models illustrate how indicator selection encodes priorities. What is measured signals what is valued. But selection alone does not determine outcomes. Construction does.
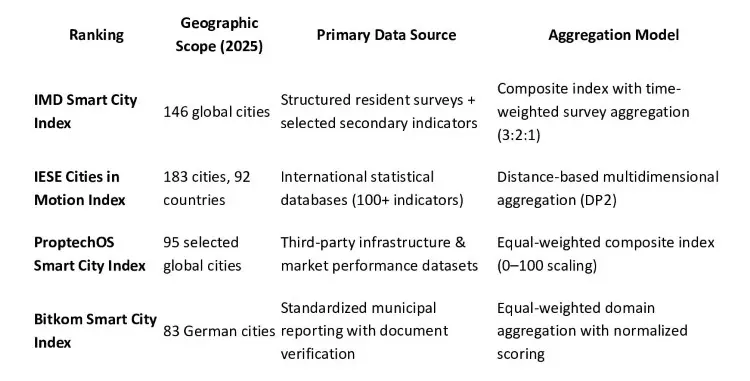
Table 1. Structural Overview of Major Smart City Rankings (2025)
Data, comparability and structural bias in smart city index methodology
Once indicators are chosen, the next issue is comparability. Global indices depend on internationally standardised datasets. Yet cities differ dramatically in statistical capacity. Some publish granular environmental and mobility data. Others rely on national-level proxies. In such cases, data maturity can influence performance.
This is a structural dimension of smart city ranking methodology that is often overlooked. Rankings may unintentionally reward cities that measure more effectively rather than those that govern more effectively.
Sample design also shapes results. IESE’s 183-city scope reflects a systemic global ambition. IMD groups cities by development level to reduce unfair comparisons. ProptechOS works with a curated international sample. Bitkom restricts comparison to Germany, increasing institutional comparability but narrowing geographic scope.
Each model operates within its own comparative logic. And that logic influences hierarchy.
Smart city ranking methodology: normalization and weighting
The most consequential stage begins once data are assembled. This is where smart city ranking methodology moves decisively into arithmetic.
Indicators must be standardised to allow aggregation. Broadband speed, air quality and governance transparency are measured in different units. Rankings therefore apply normalization techniques to place them on a comparable scale.
ProptechOS and Bitkom use 0–100 scaling. IMD incorporates temporal smoothing through a three-year weighted average. IESE’s DP2 method measures statistical distance from a benchmark while reducing redundancy between correlated variables.
Weighting adds another layer. IMD prioritises recency through its 3:2:1 structure. IESE’s weighting is embedded in its statistical aggregation method. ProptechOS and Bitkom rely on equal weighting for clarity and transparency.
These choices are technical, but they are not neutral. Smoothing enhances stability but may delay visible change. Equal weighting improves interpretability but assumes equivalent importance across domains. Distance-based aggregation increases statistical discipline but reduces intuitive readability.
In closely ranked groups, even modest methodological adjustments can shift positions. For business actors using rankings as signals, that nuance matters. For investors, consultants and urban strategists, understanding smart city ranking methodology is not optional. It is strategic.
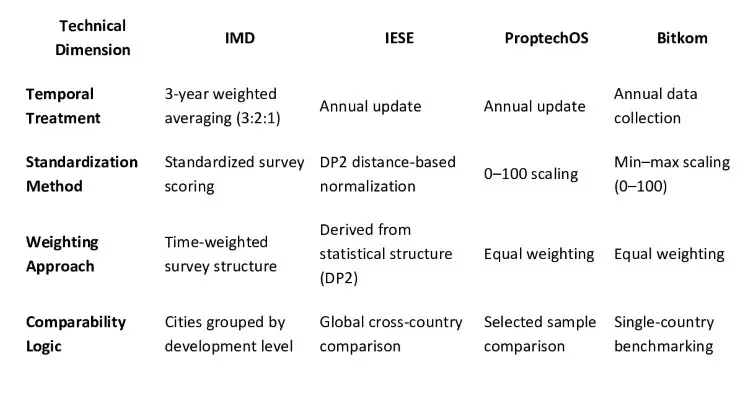
Table 2. Key Technical Design Features (2025)
City case: Bucharest’s rapid rise
A recent example illustrates how methodology interacts with perception. In the 2025 IMD Smart City Index, Bucharest reportedly climbed more than twenty positions compared to earlier editions. Such a jump invites scrutiny. Structural transformation in mobility systems, governance or environmental performance rarely occurs within a single year.
Several factors may explain the movement. Improvements in public service visibility can influence perception scores relatively quickly. Changes in response patterns or survey composition may also play a role. Because IMD applies three-year weighted averaging, recent positive responses can gradually amplify upward momentum. In tightly clustered rankings, relatively small perception shifts may translate into noticeable rank changes.
The point is not to question the result. It is to recognise that rankings capture both structural change and interpretive dynamics. For policymakers, investors and analysts, rapid upward movement should prompt deeper investigation into domain-level performance rather than immediate celebration.

Photo: Freepick
From measurement to strategy
How, then, should cities read these rankings?
First, match the ranking to the strategic question. A perception-based index cannot answer the same questions as an infrastructure-focused model.
Second, look beyond the composite score. Domain-level results often reveal tensions that aggregate rankings conceal.
Third, triangulate. If perception-based and infrastructure-based indices tell different stories, the divergence itself becomes analytically valuable.
Rankings are tools. They can illuminate patterns and encourage institutional learning. But cities do not become smarter by climbing a table. They become smarter when digital tools are integrated with governance capacity, inclusion and long-term quality of life. That transformation always extends beyond the numbers. Ultimately, smart city ranking methodology should inform strategy, not define it.