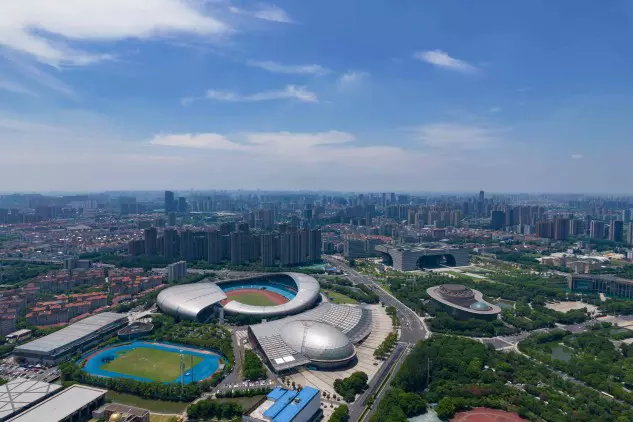
At 6:15 pm on a matchday, the biggest risk to Mexico City is not traffic. It is the moment when a major transfer station slows entrances for safety and passenger flow begins to spill into streets already operating near saturation. During the 2026 World Cup, smart megacity mobility coordination will matter more than infrastructure expansion.
From June 11 to July 19, 2026, World Cup matchdays will stack visitor travel on top of Mexico City’s evening commute. The mobility risk is not lack of transport supply. In practice, the bigger risk is fragmented governance across multiple operators and 16 borough governments, which complicates real time decisions when minutes matter and when delays can spread across the network within minutes.
Context for international readers
Mexico City’s metropolitan region is about 21 million people, with 9.21 million in the city proper. Tourism is already high at about 29.1 million domestic and international visitors per year, or roughly 79,700 per day.
Using an industry working range of 1.5 to 2.5 million visitors over the 39 day tournament, the implied daily increment is 38,000 to 65,000 visitors. That represents a 48% to 82% uplift above baseline visitor demand. In practical terms, this is similar to adding another mid size European city into the evening peak, every day, for six weeks.
For large urban systems, this is exactly the type of demand shock that tests urban transport governance, not only infrastructure capacity.
Where pressure concentrates in real streets and stations
Polanco and Zona Rosa concentrate hotels and nightlife. Polanco’s labor density reaches[1] 32,000 workers per km², almost five times the city average of residents of 6,163. For European comparison, this is comparable to Paris business districts (~30k/km²). In environments like this, sidewalks, curbs, and station platforms can move from busy to saturated very quickly once flows exceed design assumptions.
Centro Histórico is the civic core and fan zone magnet. The Zócalo functions similarly to the Hôtel de Ville area in Paris or Puerta del Sol in Madrid. It is a symbolic center that also concentrates transfers and event activity, often within the same few blocks.
This spatial concentration is a classic World Cup transport planning risk pattern. Symbolic public spaces become mobility pressure nodes where small operational delays can affect thousands of trips.
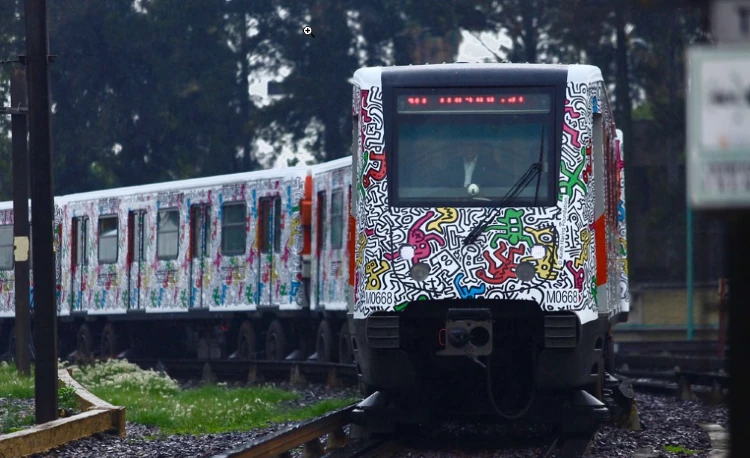
Line 2: the brittle chokepoint in metro capacity management
The Metro runs 12 lines, 195 stations, and 226 km, with about 612.5 million annual boardings.
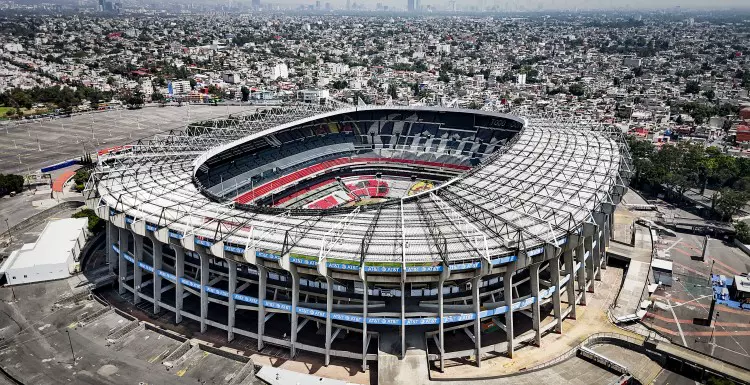
Line 2 is the system’s most exposed corridor. In 2025 it recorded about 543,098 average daily users and operated over their theoretical capacity. Zócalo station alone processed 33,368 average daily trips, about 74% above the average of any other station in Mexico City.
International guidance usually treats 80% to 120% of design capacity as a safer operating band. Reliability and safety risks rise significantly beyond roughly 130%.
In practice, metro capacity management is less about theoretical maximum capacity and more about how quickly systems can absorb disruption during peak flow periods.
How system failure actually happens
The collapse mechanism is operational, not theoretical.
When concourses fill, operators meter entrances for safety. For passengers, this often looks like queues that stop moving. Operationally, it delays boarding, increases dwell time, reduces throughput, and pushes riders toward adjacent lines or to street level, where curb space is already contested.
In this scenario, matchday demand adds 21,280 to 45,500 daily Metro riders during peak hours. If roughly 60% concentrates on Line 2 toward the Zócalo and stadium corridor, the line approaches 119% of operational capacity in critical hour windows.
In metro capacity management, failure rarely looks like a shutdown. More often, it appears as delays multiplying faster than the system can absorb them across multiple parts of the network.
Redundancy only works with megacity mobility coordination
Metrobús is the primary parallel backbone: seven lines, 283 stations, 125 km, about 660 buses, and a 20% to 25% speed advantage in dedicated lanes when enforcement holds.
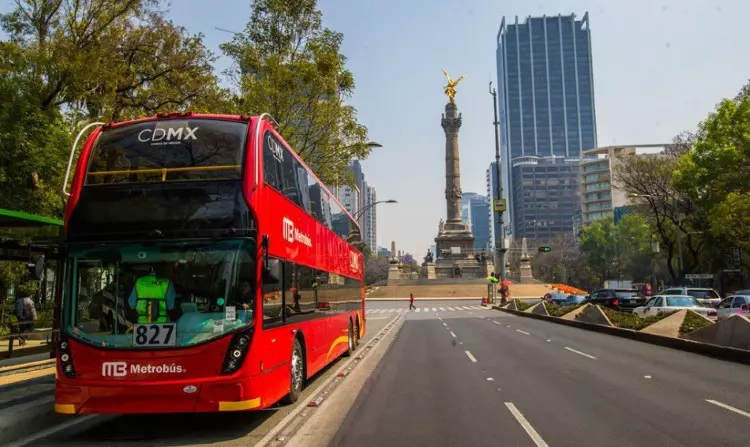
Its capacity becomes real only if the city protects bus lanes, prioritises signals, controls crossings at hotspots, and extends late service on matchdays. Otherwise, dispersal shifts to taxis and ride hailing, increasing curb congestion and slowing surface movement across entire districts.
Ecobici adds last mile flexibility. The system has 2,600 bicycles and 250 stations, with about 3,500 daily trips baseline. Scenario modelling suggests 12,000 to 26,000 daily trips during the tournament if safe links are protected.
This is a core principle of event mobility planning. Redundancy exists on paper but only becomes real through enforcement, operations, and clear passenger information.
International playbooks for urban transport governance
Brazil 2014 demonstrated the infrastructure pathway. Host cities expanded high capacity corridors, particularly BRT (Bus Rapid Transit), because dedicated right of way can be delivered faster than rail within event timelines. The key lesson was protection: station queuing, signal priority, and physical lane enforcement that makes the time advantage visible to passengers.
France 1998 demonstrated the coordination pathway. Stade de France was built with about 800 parking spaces for 80,000 spectators. The constraint worked because the metropolitan transport system operated as a single machine, aligning rail operations, crowd control, and passenger information across agencies. In practice, coordination acted as a capacity multiplier.
Paris 2024 updated the model using restrictions and workforce measures. The Games deployed about 185 km of Olympic lanes and reinforced service by roughly 15%. A dedicated transport app and temporary travel pass simplified navigation. Critically, the government encouraged telework through an interministerial circular dated 22 November 2023, linking labour policy to transport operations to flatten peaks.
Demand management: the cheapest capacity in transport demand management megacity strategy
For CDMX (Integrated Mobility System), translation is practical.
Potential actions include:
- Treating Metrobús corridors as matchday shuttle priority corridors
- Time limited vehicle restrictions near Zócalo and key interchanges
- Multilingual staff and wayfinding to guide visitor flows
- Telework and staggered schedules to reduce background commuter peaks
These are core tools of transport demand management megacity strategy. They shift when travel happens, not only how, and reduce the risk that multiple peak flows collide at the same hour.
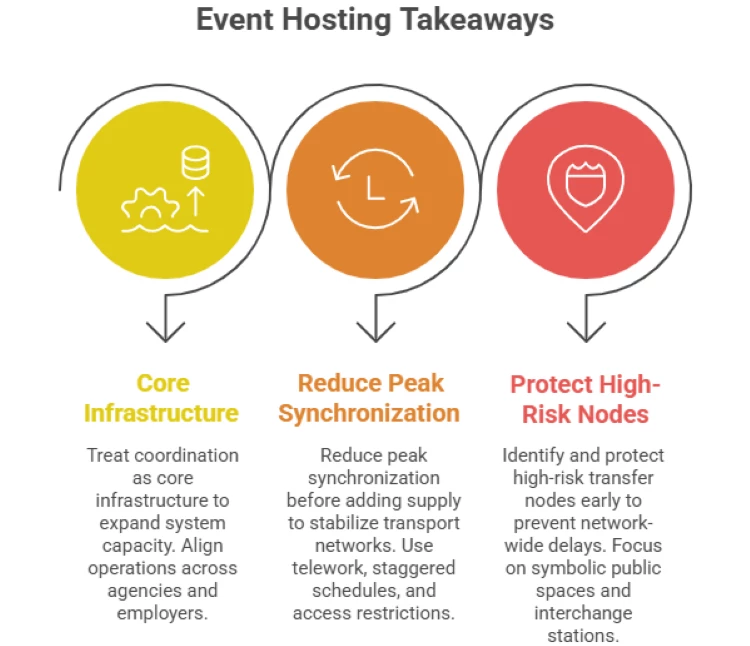
Conclusion: The future of megacity mobility coordination is temporal, not physical
The fastest capacity expansion is temporal. Reducing peak synchronisation between commuters and event travel protects system stability and reduces the risk of cascading delay across networks.
Tokyo 2020 documented that more than 90% of participating organisations used telework, staggered hours, or planned leave. Mexico already has a telework compliance framework that can scale rapidly for many office roles.
The missing instrument for CDMX is a matchday mobility calendar, issued early and repeated often. This would align public sector telework, stagger schedules for major employers in congested zones, and guarantee surface priority for Metrobús plus safe walking and cycling near hotspots.
Many megacities already operate above theoretical capacity. The next frontier is not building faster. It is coordinating smarter.
The real question for global cities is no longer how to move more people.
It is how to prevent millions of trips from happening at the same hour and how megacity mobility coordination becomes core urban infrastructure.
[1] ~106,000 workers from 4,639 establishments (DENUE INEGI) × ~23 employees/UE average (Censos Económicos 2024) / 3.27 km² ≈ 32,400/km². DENUE; Censos Económicos
About the author: Jonathan Jiménez Mendoza is CEO of NUMADI, working at the intersection of policy, business development, and implementation-focused public policy.
Read more about smart and sustainable mobility here and here